Correlating Code & Community (part 3)
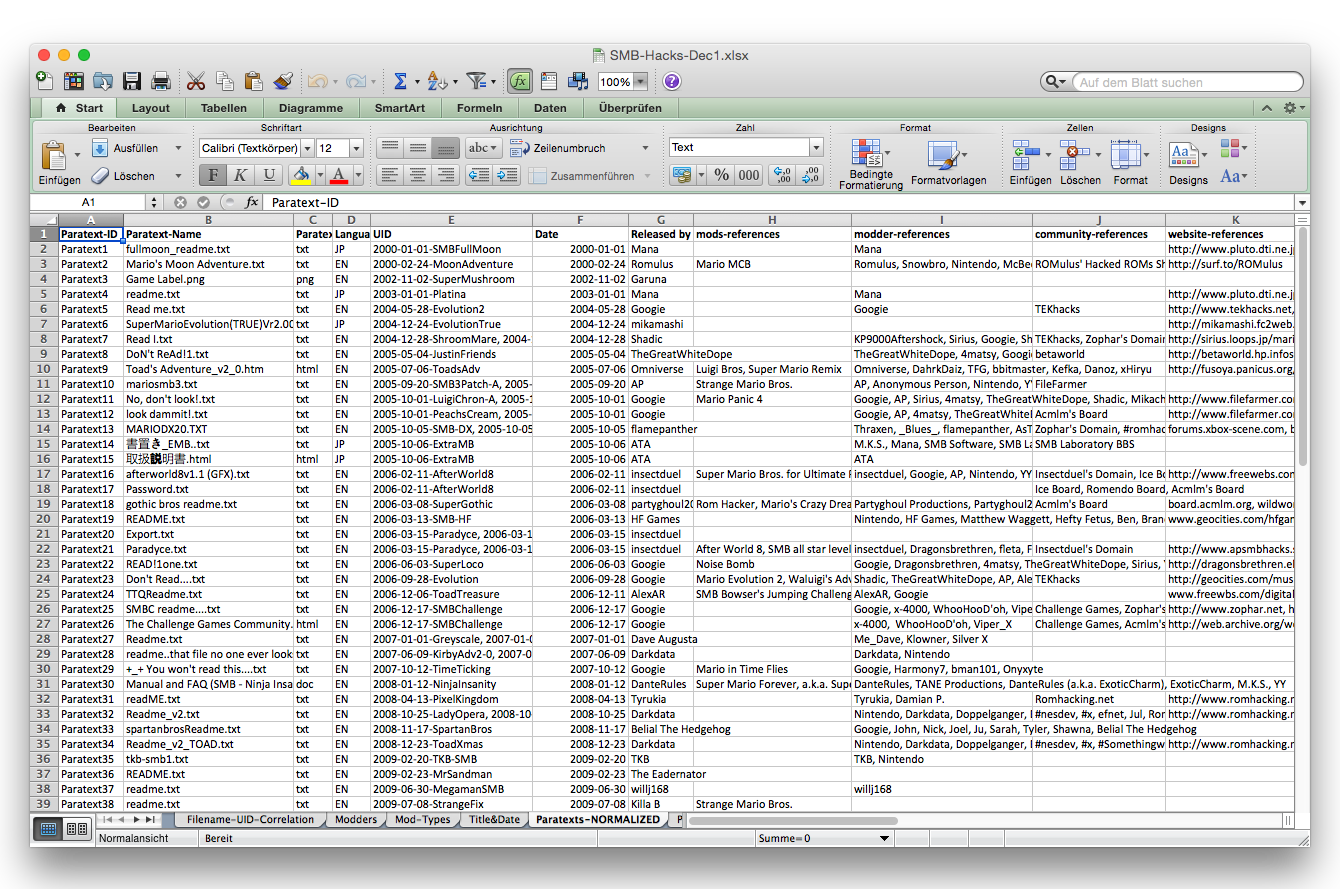
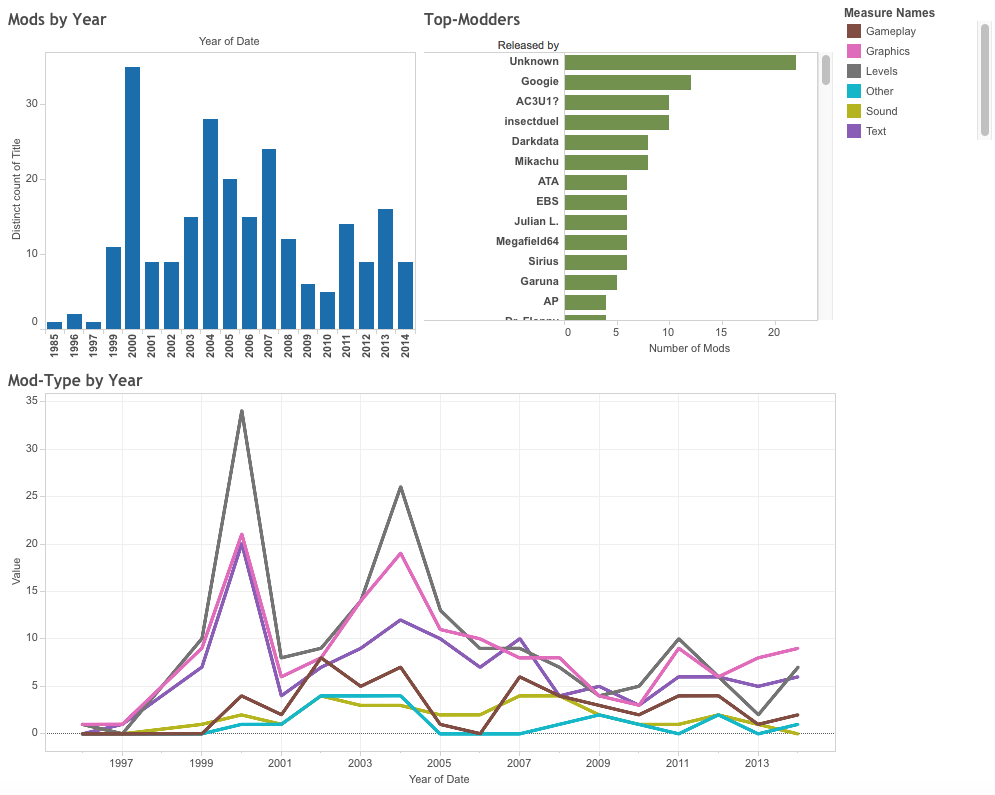
The first step in my attempt to combine DH and CCS approaches was to mine data from the ROMhacking website and paratexts distributed with the patches and to create a spreadsheet with relevant metadata. (All of this data is also included in the "Tools" rubric of this webtext.) On this basis, I began an effort to analyze and visualize the data with the visualization software Tableau. But while this yielded some basic information that might be relevant for assessing the serial community (e.g. the number of mods produced each year, including upward and downward trends; a list of the top modders in the community; and a look at trends in the types of mods/hacks being produced), the visualizations themselves were not very interesting or informative on their own.
How could this high-level metadata be coordinated with and brought to bear on the code-level serialization processes that we saw in the hexcode? In looking for an answer, it became clear that I would have to find a way to collect some data about the code itself. The mods, themselves basically just "diff" files (i.e. files containing a record of the differences that are to be instantiated with respect to the original ROM file that is to be patched and "modded"), could be opened and compared with the "diff" function that powers some forms of DH-based textual analysis (for example, text comparisons conducted with a piece of software like juxta). But the hexadecimal code that we can access here — and the sheer amount of it in each modded game, which consists of over 42000 bytes — is not particularly conducive to analysis with such tools. 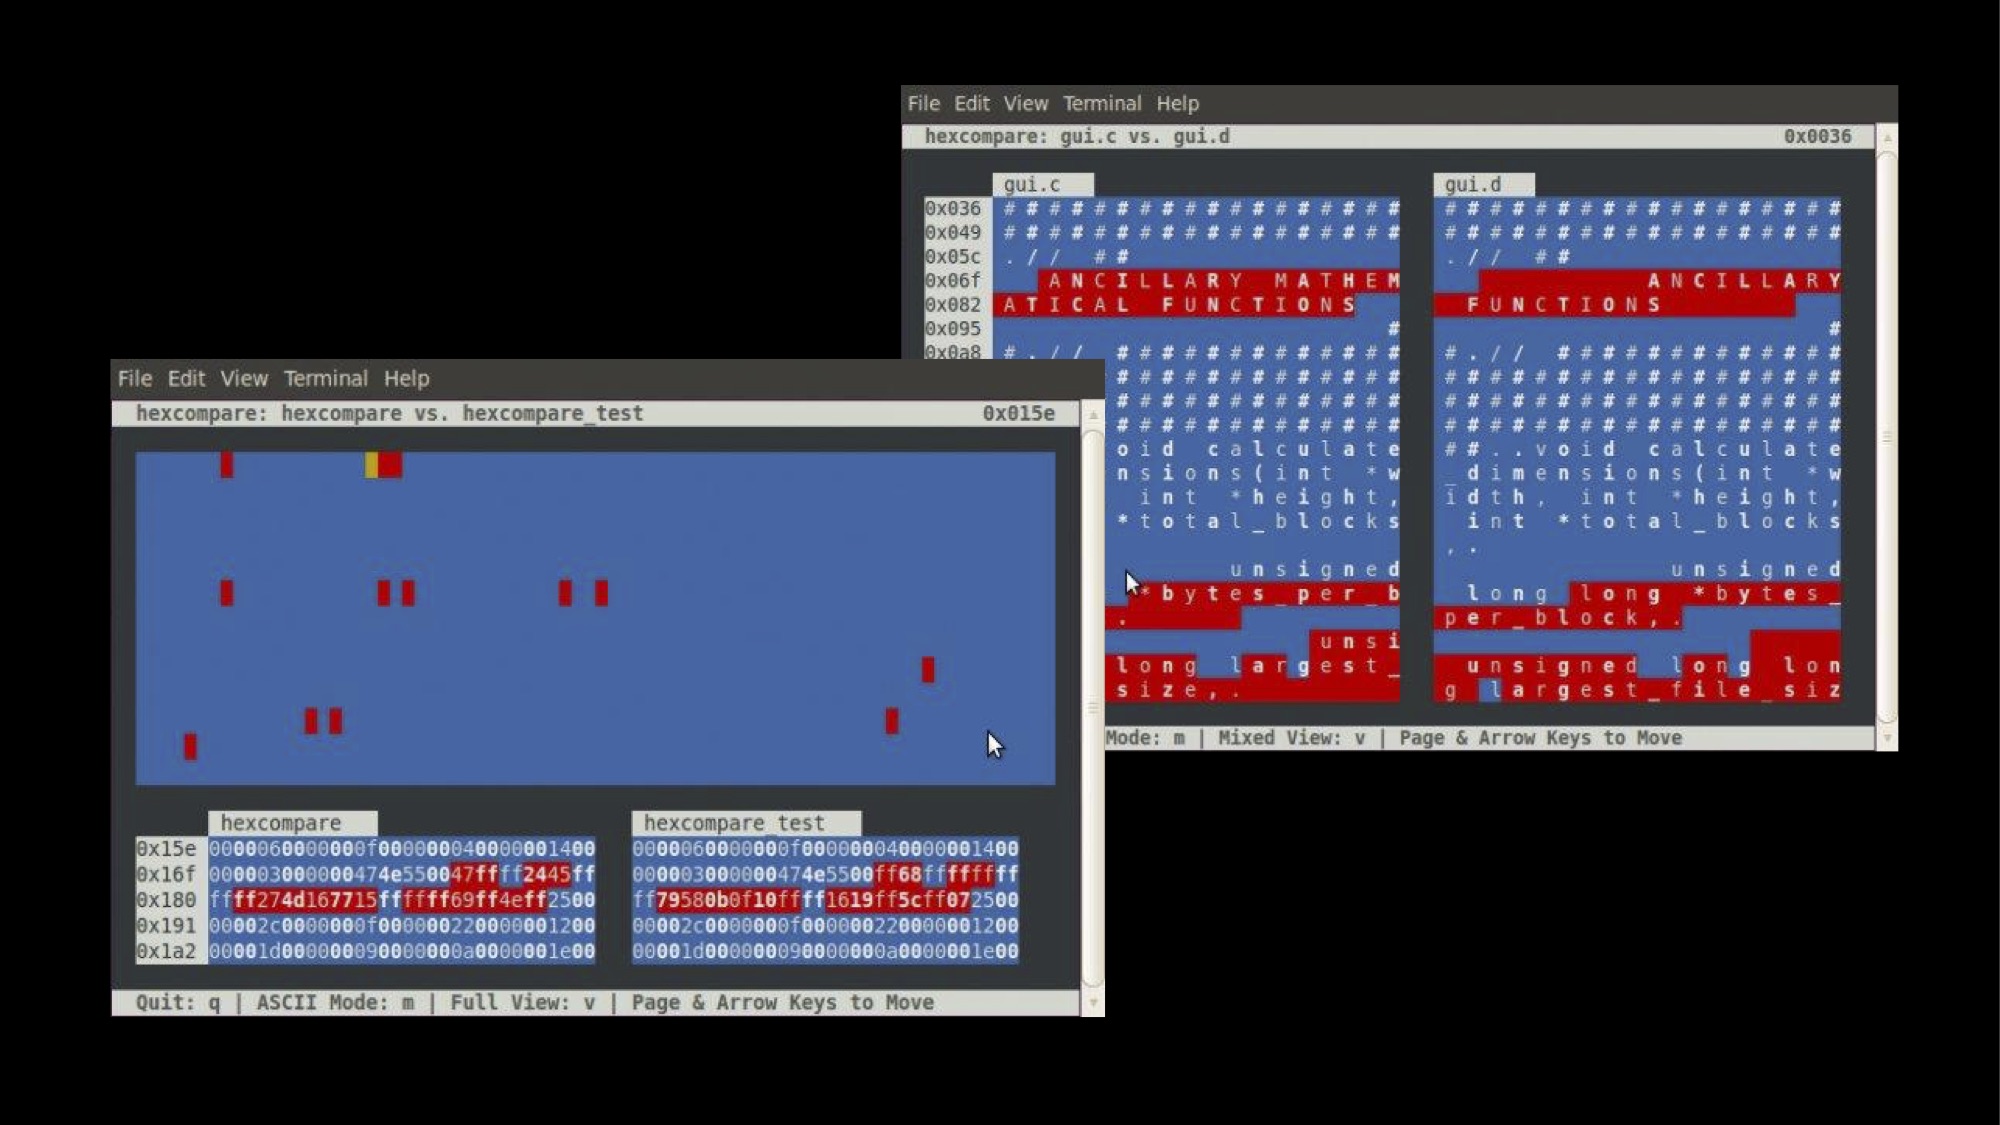 Many existing hex editors also include a "diff" analysis, but to facilitate a greater degree of usability and hence to enable more efficient research methods it would be desirable to have a graphical display of differences between the files in order to see the changes at a glance. Hexcompare, a Linux-based visual "diff" program for quickly visualizing the differences between two binary programs (as seen in the images to the right), provides a model for this type of comparison. However, the comparison thus enabled is restricted by limitations of the software: it is available only for local use on a Linux machine (no online or cross-platform compatibility), and it only considers two files at a time. If this type of analysis is to be of use for seriality studies, which deals with larger sets and sequences of repetition and variation, it will have to assess a much larger set of files and/or automate the comparison process.
In order to overcome these limitations, it was necessary to rethink the ways that the underlying code of the game mods is assessed, structured as data, and made available for visualization. The alternative approach outlined here was developed in conjunction with colleagues from Duke University's Visualization & Interactive Services. In particular, Eric Monson wrote a script in Python that analyzes the mod patch files and records the basic "diff" information they contain: the address or offset at which they instruct the computer to modify the game file, as well as the number of bytes that they instruct it to write. With this information, a much more useful and interactive visualization can be created with Tableau.
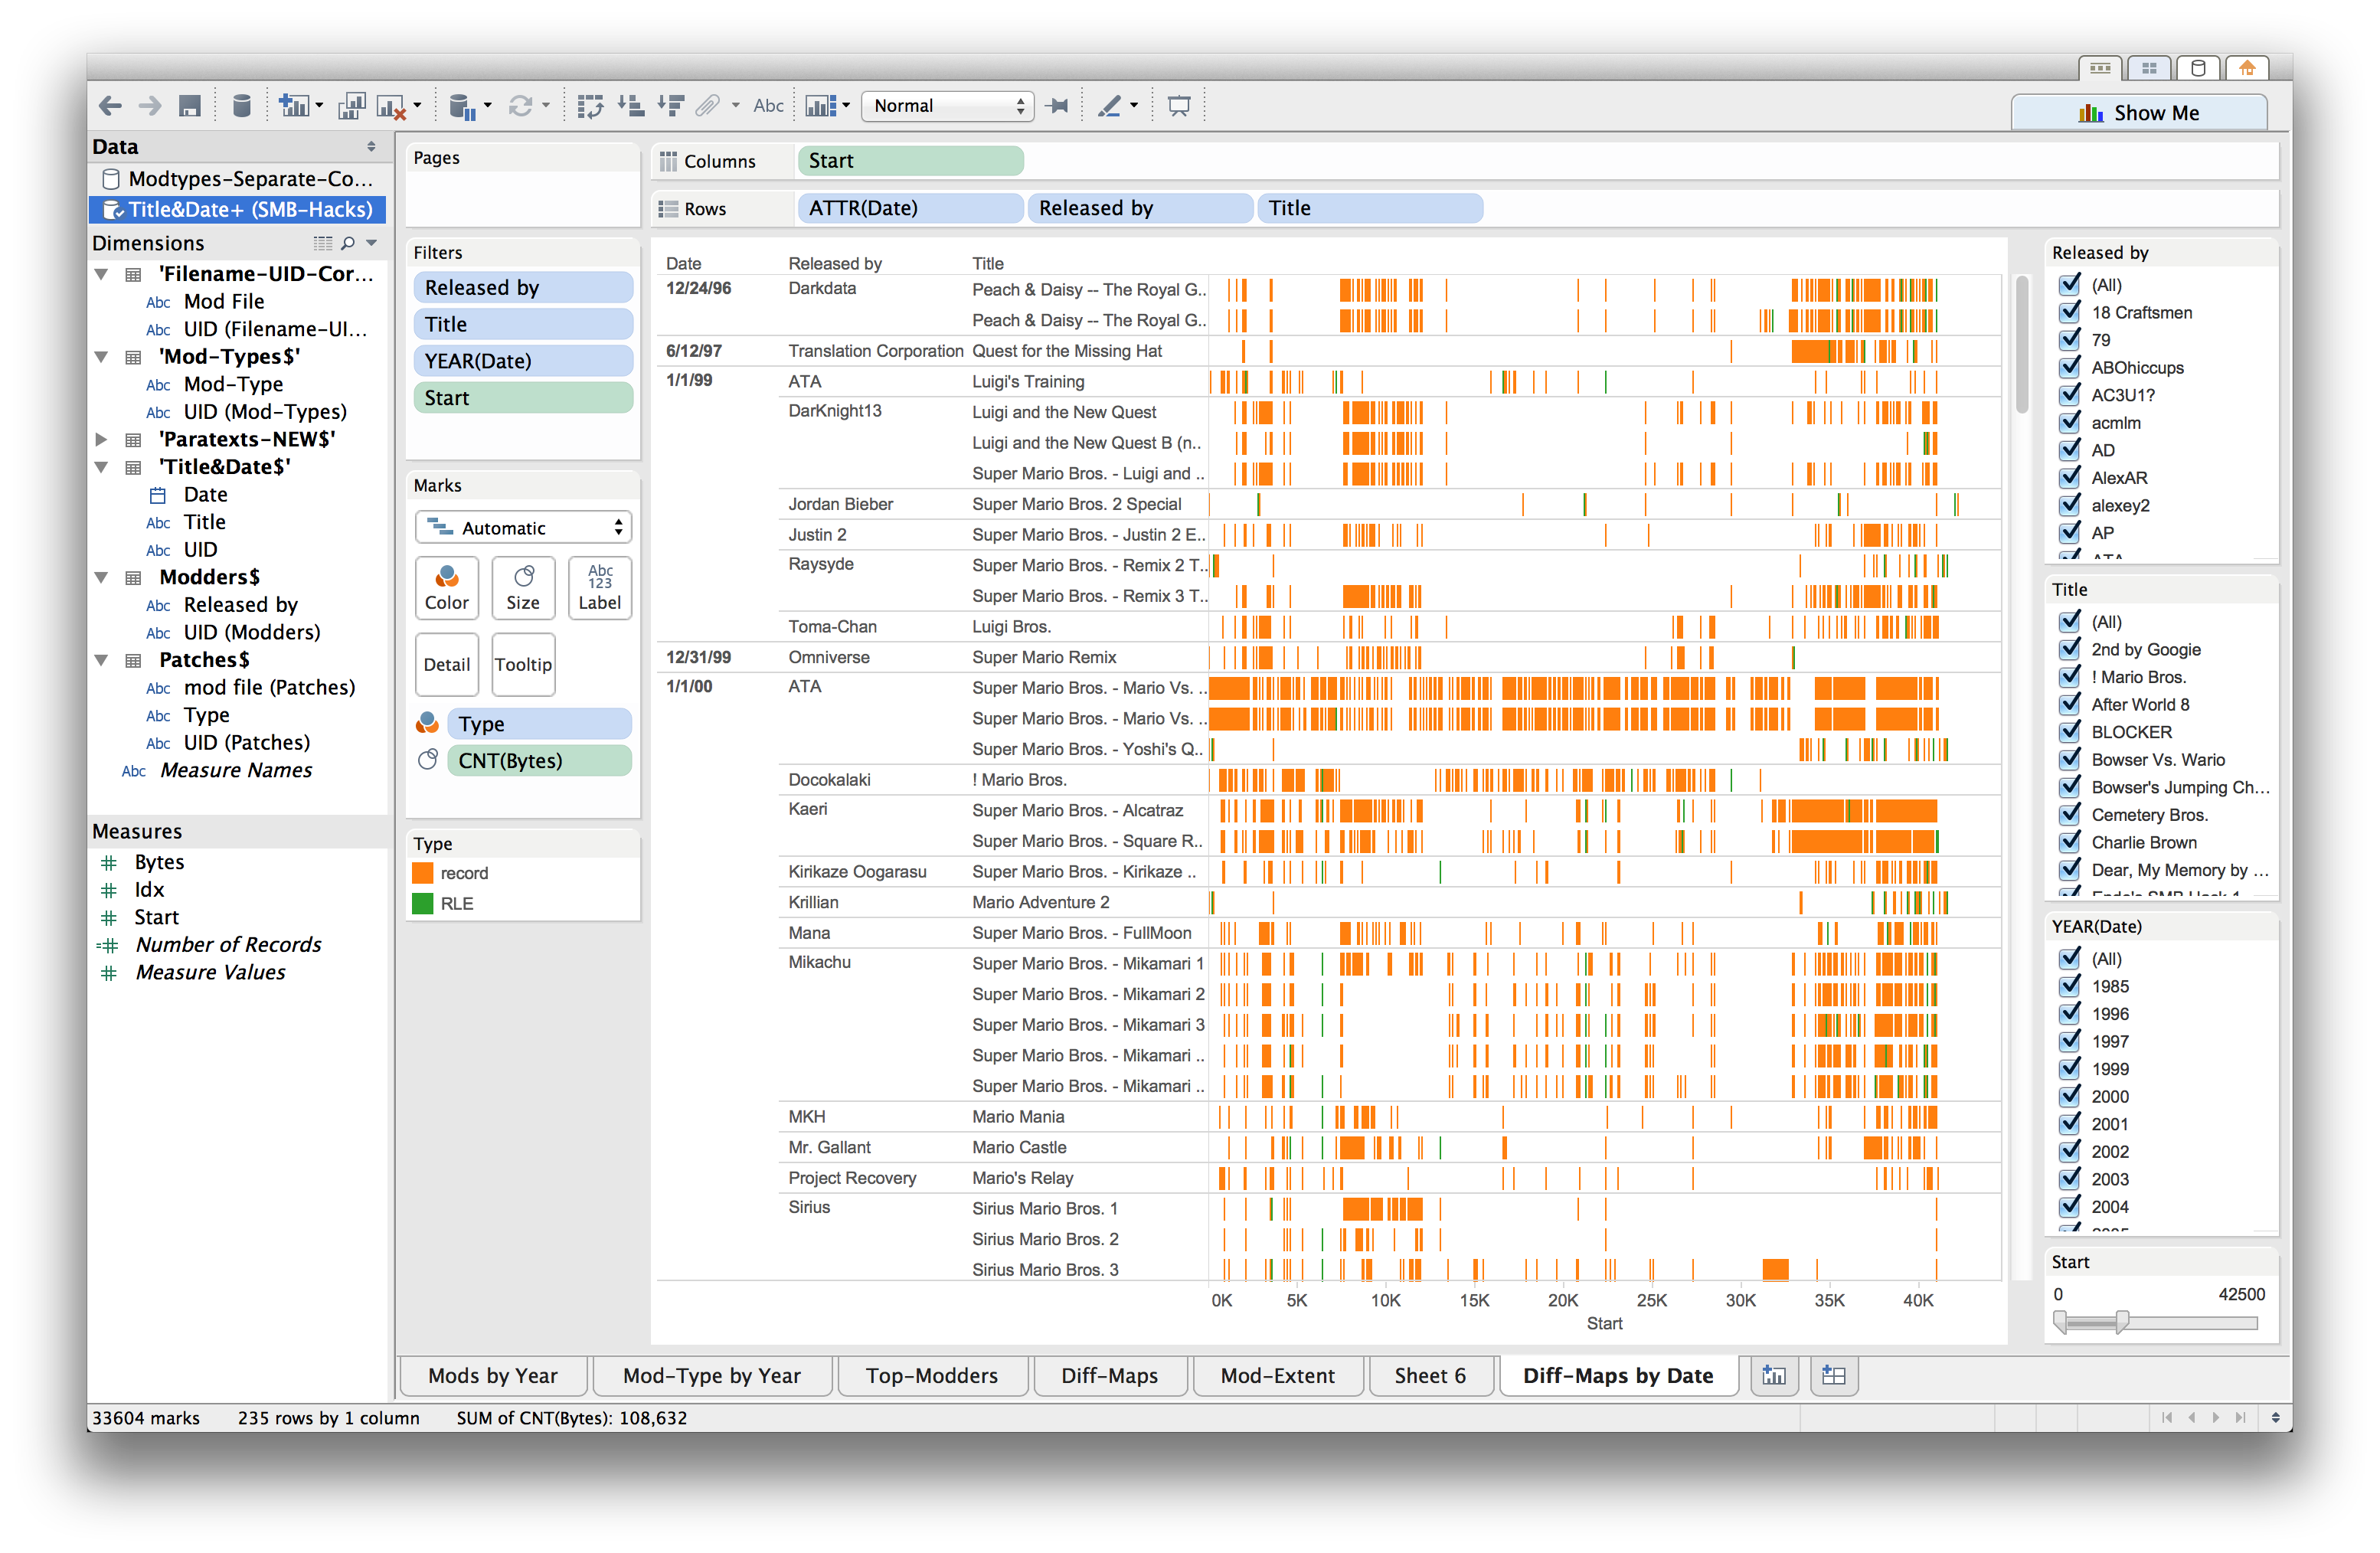
The resulting visualization uses Gannt charts, following a suggestion from Angela Zoss, to represent the size and location of changes that a given mod makes to the original Mario game; thus, it becomes possible to see a large number of these mods at a single glance, to filter them by year, by modder, by title, or even size, and in this way we can begin to see patterns emerging. (These interactive visualizations are included in the "Tools" section of this webtext.) In this way, a sort of "distant reading" is brought to bear on the level of code, combining DH and CCS in a way that renders serialization processes visible over a large set of code-level data. In order to understand the specific contribution of DH-type visualization here, contrast this approach with Marino's 2006 call to "make the code the text," which despite his broad understanding of code and acknowledgement that software/hardware and text/paratext distinctions are non-absolute, was still basically geared towards a conception of CCS that encouraged critical engagements of the "close-reading" type. As I have argued, however, researching seriality in particular requires that we oscillate between big-picture and micro-level analyses, between distant readings of larger trends and developments and detailed comparisons between individual elements or episodes in the serial chain.
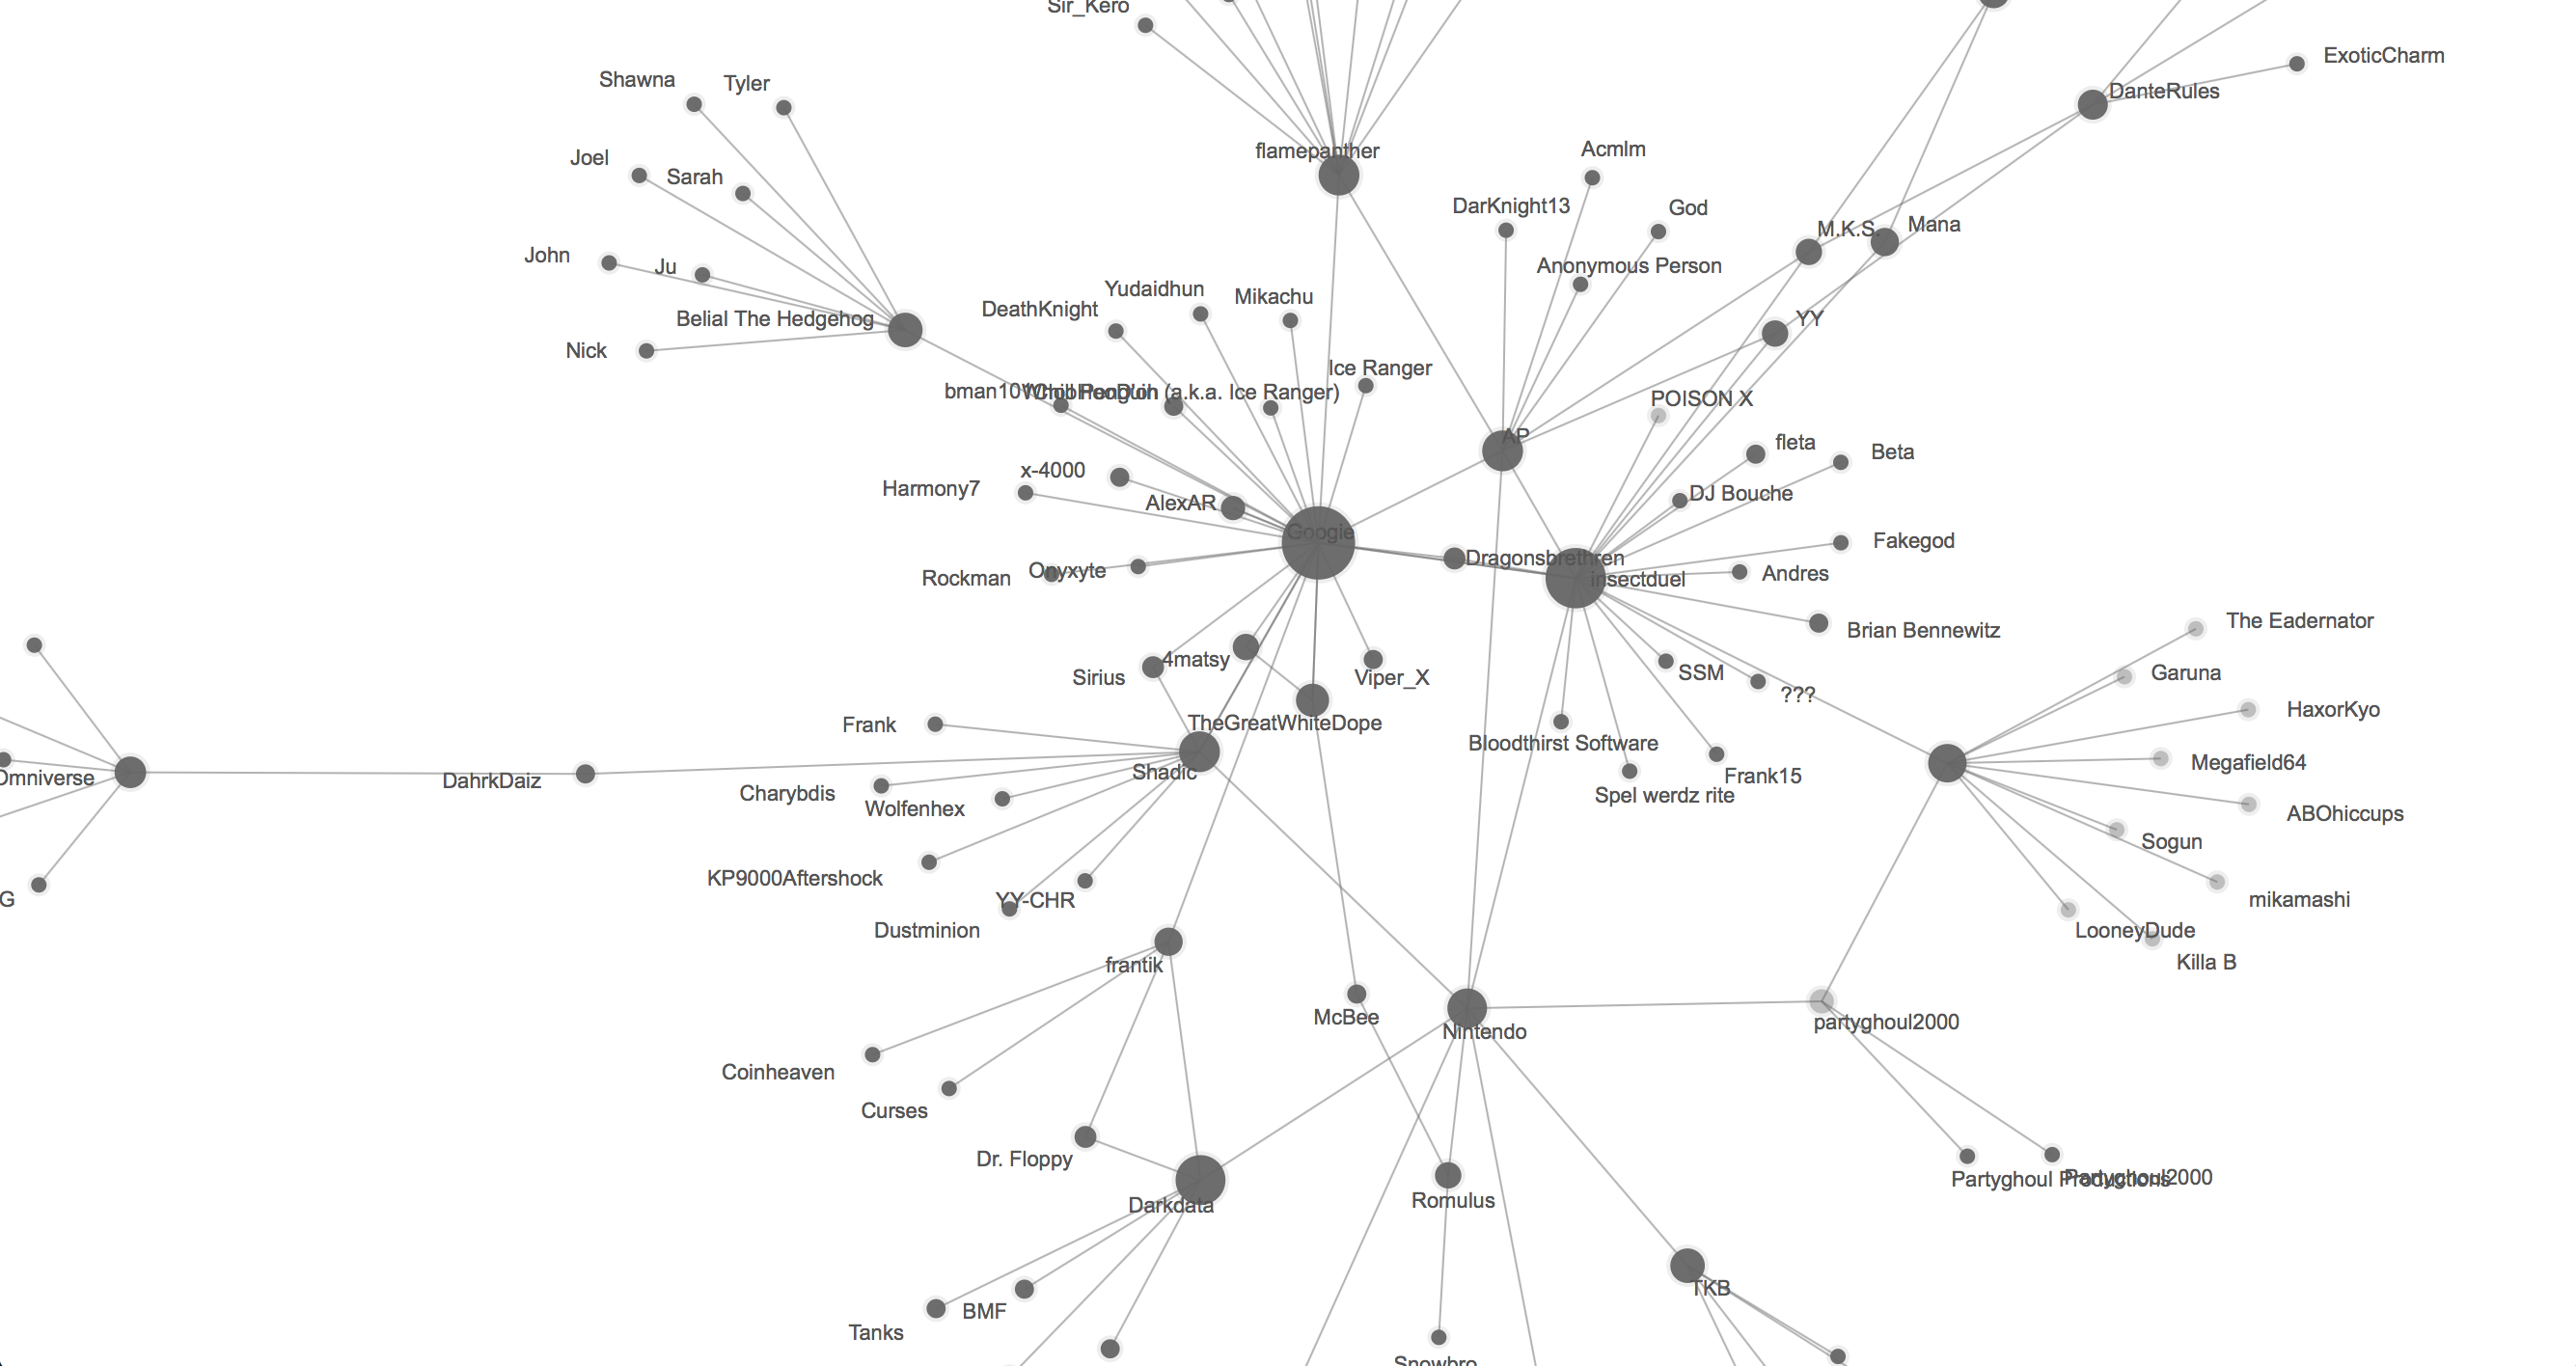
In order to complete this approach, however, it is still necessary to correlate this code-based data with the social level of online modding communities. For this purpose, it is useful to employ network graphing software, for example Palladio (a tool explicitly designed for DH work by the Humanities + Design lab at Stanford University), which I used to graph networks of actors and intertextual relations on the basis of metadata contained in "Readme.txt" and other paratextual files accompanying the mod patches distributed on ROMhacking.net. Here, for example, I have mapped the references (or "shout-outs") that modders made to one another in these paratexts, thus revealing a picture of digital seriality as a kind of "imagined community" (Anderson 1991) of modders:
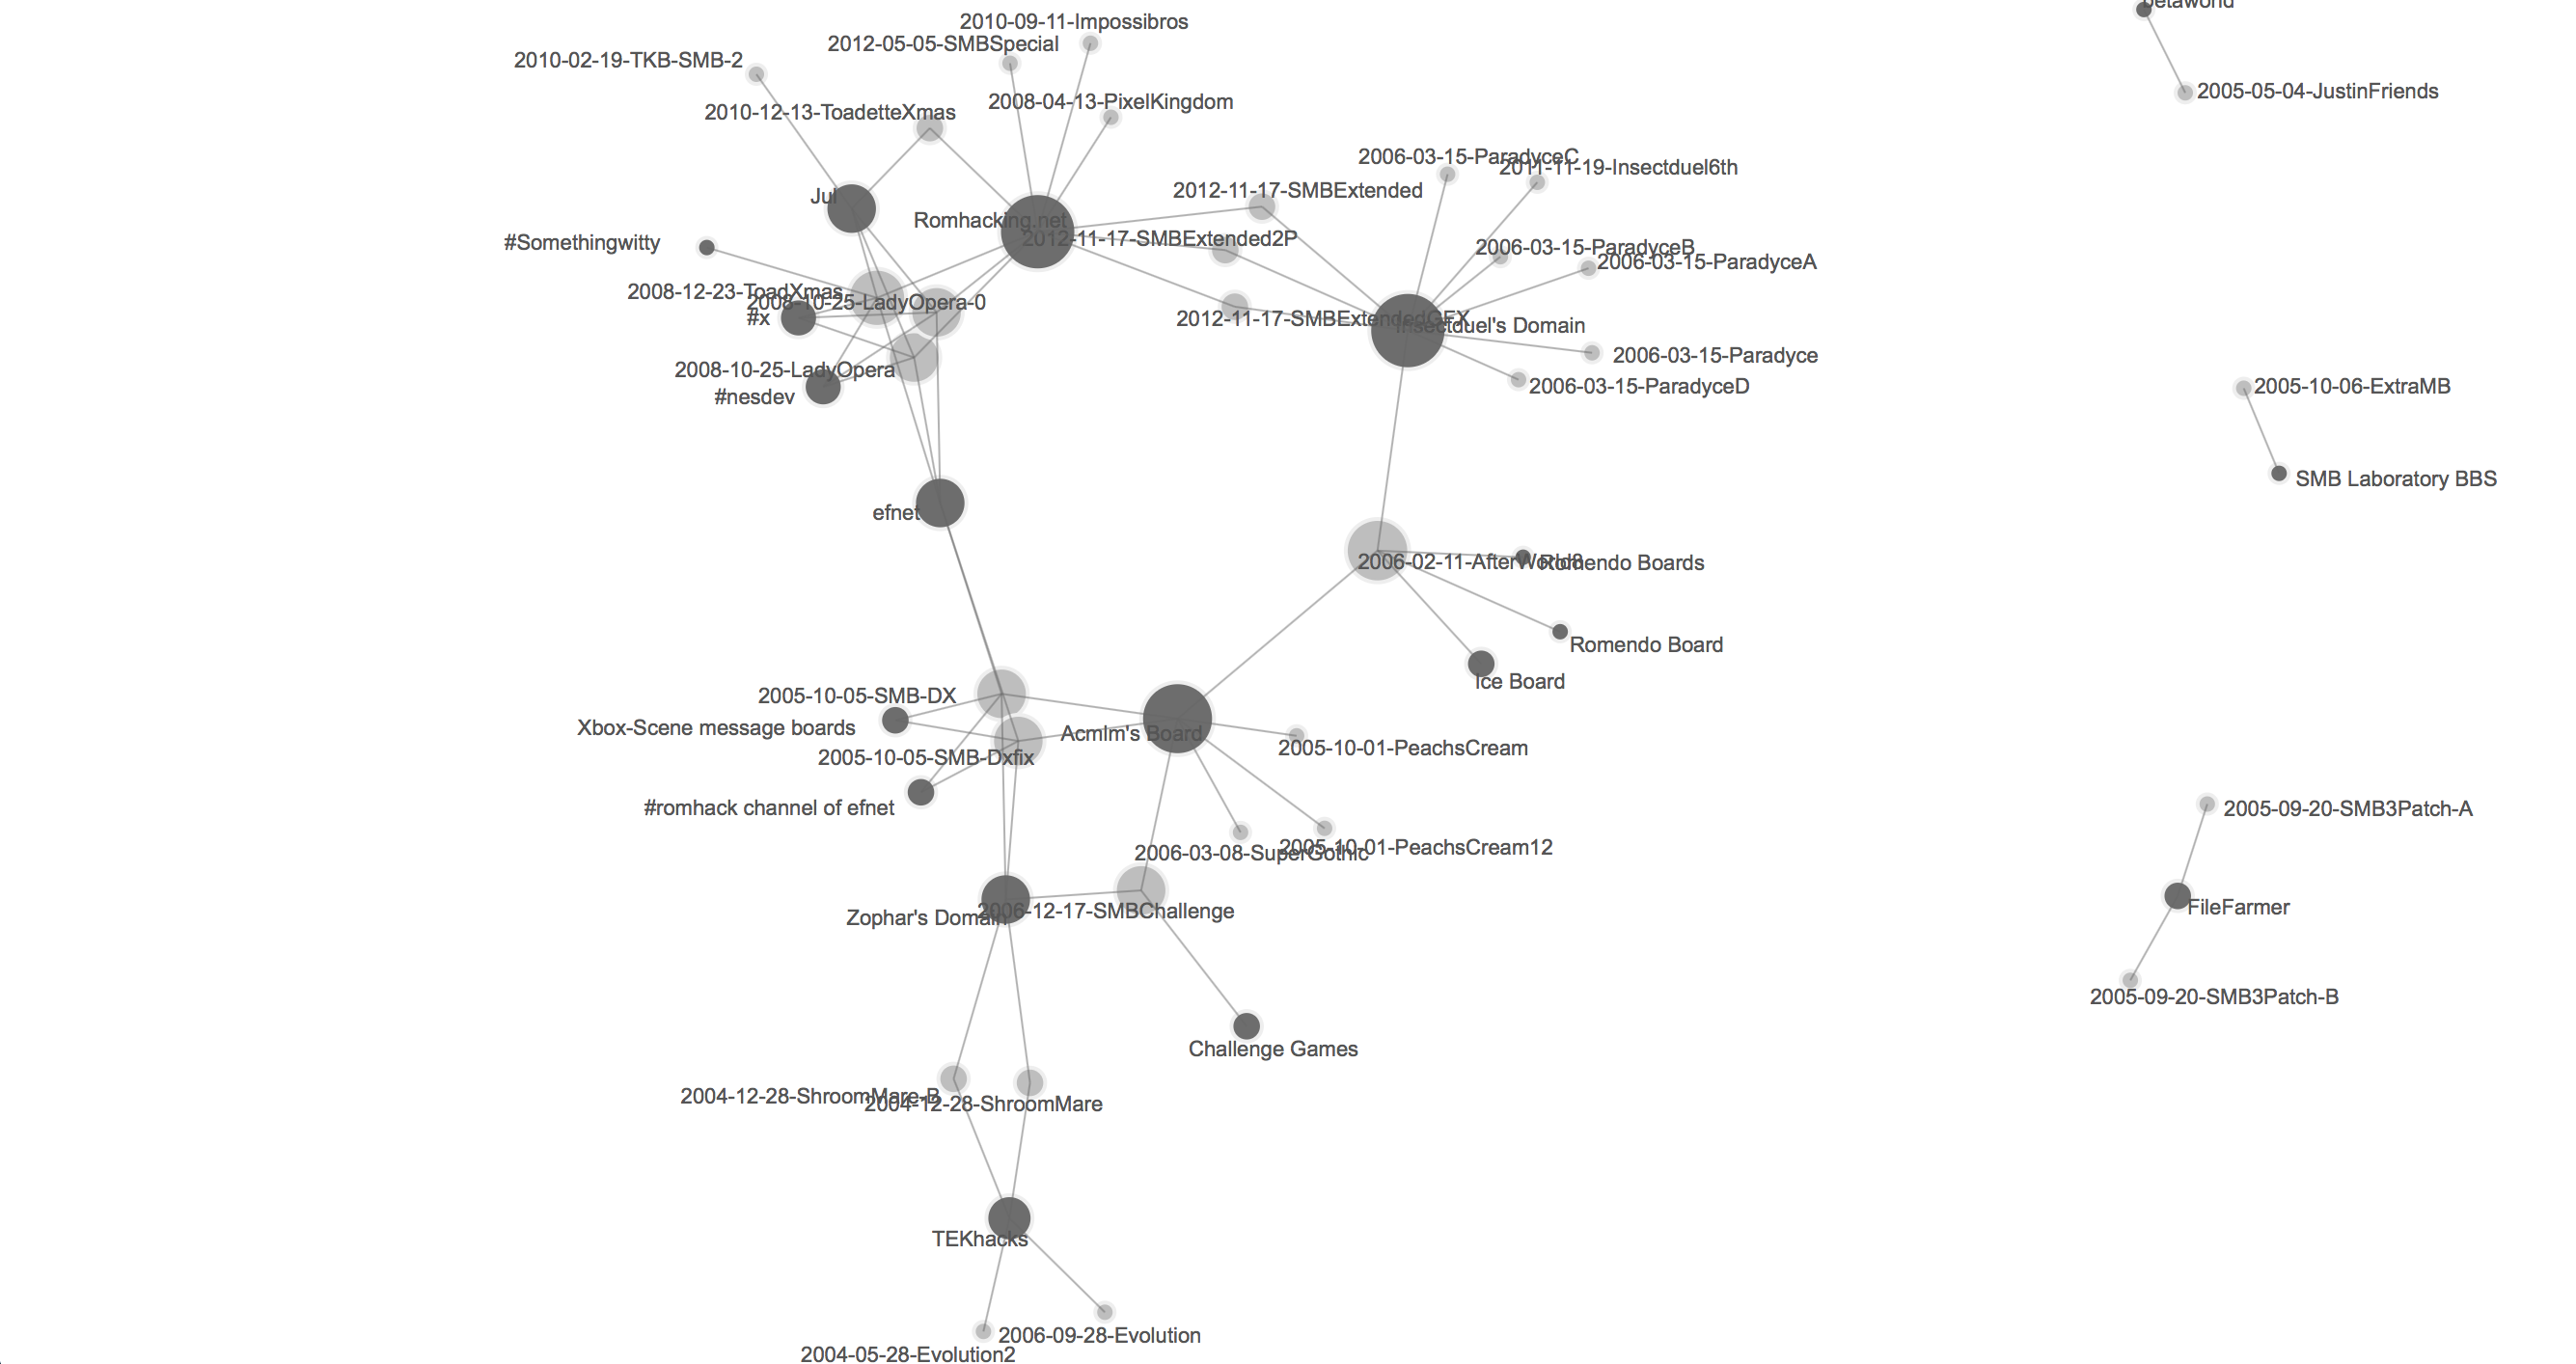
Below, on the other hand, I have mapped paratextual references to various online communities that have come and gone over the years. We see early references to the now defunct TEKhacks website, by way of Zophar's Domain, Acmlm's and Insectduel's boards, with more recent references to Romhacking.net, the most recent community site and the one that I am studying here.
Such visualizations, because they are subject to various configurations and filterings of relevant parameters, offer a useful instrument with which to begin mapping the community formations that emerge and morph over time, both within and across the community forums that are designed to serve them. Together with the code-level visualizations discussed above, network graphs are thus an indispensable tool in the effort to trace serialization processes across the various levels of digital games and gaming communities.
(Note that one of the limitations of Palladio is that it is not possible to save and embed these visualizations for online interactive use. Thus, in the "Tools" section, readers will find a variety of "Community Network" graphs rendered in Cytoscape, an open-source network visualization program that does not have these limitations, and that can output its graphs as interactive webpages. Beyond this it remains possible, however, for interested readers to copy the underlying data, also included in the "Tools" section, and to utilize Palladio for local browser-based filtering and analysis.)